The 200 top U.S. startup cities for venture capital (VC) investment for 2020 provide few surprises. The top four startup cities are the same for the third year in a row, and San Francisco holds on to its top spot for its 14th year. However, there are some changes to explore from the industry’s ongoing evolution and the COVID-19 crisis.
| Rank | Location | $mil. | Deals | Funded | +/- |
| 1 | San Francisco, CA | 12,482 | 216 | 1,328 | 0 |
| 2 | New York, NY | 7,056 | 195 | 1,178 | 0 |
| 3 | Boston, MA | 3,651 | 41 | 304 | 0 |
| 4 | Cambridge, MA | 4,565 | 40 | 227 | 0 |
| 5 | Seattle, WA | 1,850 | 41 | 230 | 2 |
| 6 | San Diego, CA | 3,230 | 38 | 196 | 2 |
| 7 | Palo Alto, CA | 1,352 | 31 | 259 | -2 |
| 8 | Mountain View, CA | 4,645 | 21 | 143 | 4 |
| 9 | Los Angeles, CA | 1,279 | 29 | 248 | -3 |
| 10 | Austin, TX | 799 | 27 | 229 | -1 |
| 11 | Chicago, IL | 818 | 26 | 189 | 1 |
| 12 | San Jose, CA | 945 | 23 | 127 | -1 |
| 13 | Irvine, CA | 3,077 | 14 | 59 | 19 |
| 14 | South San Francisco, CA | 1,781 | 14 | 72 | 4 |
| 15 | Philadelphia, PA | 757 | 13 | 131 | -5 |
| 16 | Redwood City, CA | 1,609 | 11 | 111 | 1 |
| 17 | Santa Clara, CA | 760 | 14 | 90 | 2 |
| 18 | Denver, CO | 709 | 16 | 82 | 7 |
| 19 | Menlo Park, CA | 624 | 16 | 95 | -5 |
| 19 | San Mateo, CA | 875 | 11 | 103 | -5 |
| 21 | Atlanta, GA | 551 | 17 | 102 | -5 |
| 22 | Houston, TX | 656 | 13 | 71 | 2 |
| 23 | Santa Monica, CA | 452 | 12 | 94 | -3 |
| 24 | Berkeley, CA | 616 | 12 | 54 | 12 |
| 25 | Boulder, CO | 414 | 13 | 73 | -2 |
| 25 | Oakland, CA | 429 | 13 | 71 | -4 |
| 27 | Columbus, OH | 573 | 9 | 50 | 23 |
| 27 | Sunnyvale, CA | 372 | 9 | 85 | -5 |
| 29 | Waltham, MA | 496 | 7 | 41 | 27 |
| 30 | Salt Lake City, UT | 470 | 8 | 35 | 7 |
| 30 | Washington, DC | 281 | 10 | 53 | 4 |
| 32 | Bellevue, WA | 657 | 3 | 45 | -5 |
| 33 | Burlingame, CA | 593 | 5 | 31 | -4 |
| 34 | Dallas, TX | 268 | 9 | 43 | -6 |
| 35 | Portland, OR | 181 | 8 | 53 | -9 |
| 36 | Baltimore, MD | 172 | 6 | 50 | 42 |
| 37 | Fremont, CA | 404 | 4 | 23 | 1 |
| 38 | Emeryville, CA | 414 | 4 | 21 | 15 |
| 38 | Pittsburgh, PA | 237 | 2 | 135 | -7 |
| 40 | Culver City, CA | 682 | 2 | 25 | -10 |
| 41 | Somerville, MA | 280 | 4 | 25 | 0 |
| 42 | Durham, NC | 167 | 5 | 39 | -4 |
| 43 | Campbell, CA | 239 | 5 | 24 | 0 |
| 44 | San Carlos, CA | 258 | 7 | 20 | 0 |
| 44 | Wilmington, DE | 141 | 9 | 28 | 14 |
| 46 | Arlington, VA | 113 | 9 | 27 | 20 |
| 47 | Los Altos, CA | 158 | 3 | 35 | -7 |
| 48 | Florence-Graham, CA | 57 | 13 | 48 | 33 |
| 49 | Jersey City, NJ | 304 | 4 | 14 | 21 |
| 50 | Nashville-Davidson, TN | 128 | 3 | 41 | -2 |
| 51 | Miami, FL | 120 | 5 | 24 | 18 |
| 52 | Ann Arbor, MI | 109 | 3 | 41 | -20 |
| 52 | Tampa, FL | 328 | 2 | 20 | 28 |
| 54 | Indianapolis city, IN | 80 | 6 | 32 | -20 |
| 55 | Raleigh, NC | 73 | 7 | 33 | -4 |
| 56 | Milpitas, CA | 159 | 5 | 14 | 48 |
| 57 | Carlsbad, CA | 114 | 3 | 24 | -16 |
| 58 | New Haven, CT | 196 | 2 | 18 | 13 |
| 59 | Lincoln, NE | 177 | 2 | 18 | 35 |
| 60 | King of Prussia, PA | 130 | 3 | 16 | 40 |
| 61 | Sandy Springs, GA | 363 | 2 | 12 | -1 |
| 62 | Sacramento, CA | 104 | 3 | 16 | 51 |
| 63 | Walnut, CA | 145 | 2 | 17 | 8 |
| 64 | Charlotte, NC | 596 | 1 | 21 | -20 |
| 64 | Goleta, CA | 282 | 2 | 11 | 58 |
| 66 | Tysons Corner, VA | 77 | 2 | 26 | -17 |
| 67 | Newton, MA | 96 | 2 | 16 | 84 |
| 68 | El Segundo, CA | 102 | 2 | 15 | -3 |
| 69 | Newport Beach, CA | 452 | 1 | 13 | 34 |
| 69 | Phoenix, AZ | 58 | 2 | 18 | -23 |
| 71 | Rockville, MD | 128 | 2 | 11 | 142 |
| 72 | Cupertino, CA | 64 | 2 | 17 | 40 |
| 73 | St. Louis, MO | 37 | 2 | 35 | -12 |
| 74 | Hawthorne, CA | 2,336 | 2 | 5 | 53 |
| 75 | Burlington, MA | 32 | 4 | 21 | -21 |
| 76 | Minneapolis, MN | 25 | 5 | 23 | -17 |
| 77 | Scottsdale, AZ | 103 | 1 | 16 | 21 |
| 78 | Kirkland, WA | 52 | 2 | 11 | 100 |
| 79 | North Fair Oaks, CA | 306 | 2 | 5 | 147 |
| 80 | Framingham, MA | 107 | 1 | 15 | 12 |
| 81 | Cary, NC | 1,793 | 1 | 6 | 358 |
| 82 | Carmel, IN | 32 | 3 | 12 | 29 |
| 83 | Plano, TX | 145 | 1 | 10 | -16 |
| 84 | Cleveland, OH | 19 | 3 | 23 | 46 |
| 85 | Eden Prairie, MN | 269 | 1 | 7 | 192 |
| 86 | West Hollywood, CA | 29 | 2 | 13 | -31 |
| 87 | Pasadena, CA | 22 | 2 | 18 | -31 |
| 88 | St. Petersburg, FL | 57 | 2 | 6 | 263 |
| 89 | South Plainfield, NJ | 160 | 3 | 4 | 539 |
| 90 | Gaithersburg, MD | 138 | 1 | 7 | -19 |
| 91 | Newark, CA | 97 | 1 | 8 | 95 |
| 91 | Pleasanton, CA | 17 | 3 | 16 | -28 |
| 93 | Orlando, FL | 31 | 2 | 9 | 121 |
| 93 | Rochester, NY | 50 | 1 | 12 | -17 |
| 95 | Wellesley, MA | 126 | 1 | 7 | -24 |
| 96 | Hillsborough, CA | 234 | 2 | 4 | 532 |
| 97 | University, FL | 189 | 2 | 4 | 278 |
| 98 | Madison, WI | 14 | 2 | 30 | -13 |
| 99 | Santa Barbara, CA | 69 | 1 | 8 | 7 |
| 100 | Boca Raton, FL | 65 | 1 | 8 | 57 |
| 101 | St. Paul, MN | 52 | 1 | 9 | 156 |
| 102 | Mercer Island, WA | 151 | 2 | 4 | 47 |
| 103 | Mill Valley, CA | 19 | 3 | 10 | 28 |
| 104 | Woburn, MA | 32 | 1 | 14 | -57 |
| 105 | Albuquerque, NM | 11 | 3 | 20 | -1 |
| 106 | Alameda, CA | 21 | 2 | 9 | -17 |
| 107 | Aliso Viejo, CA | 30 | 1 | 12 | 1 |
| 108 | New Orleans, LA | 32 | 1 | 11 | -24 |
| 109 | Addison, TX | 22 | 2 | 8 | 284 |
| 110 | Marina del Rey, CA | 24 | 3 | 6 | 92 |
| 111 | Dover, DE | 23 | 3 | 6 | 429 |
| 112 | Boise City, ID | 20 | 2 | 8 | 3 |
| 113 | Skokie, IL | 16 | 3 | 8 | 103 |
| 114 | Lake Forest, CA | 52 | 1 | 6 | 355 |
| 115 | Albany, NY | 11 | 4 | 10 | 3 |
| 116 | Richmond, VA | 24 | 1 | 11 | 47 |
| 117 | Nashua, NH | 71 | 1 | 5 | 322 |
| 118 | Beverly Hills, CA | 14 | 2 | 10 | -39 |
| 119 | Bend, OR | 35 | 1 | 7 | 129 |
| 120 | Providence, RI | 18 | 1 | 13 | -4 |
| 121 | Irving, TX | 26 | 1 | 8 | 307 |
| 122 | Lewes, DE | 20 | 3 | 5 | 169 |
| 123 | Charleston, SC | 51 | 1 | 5 | 15 |
| 124 | Chapel Hill, NC | 23 | 2 | 5 | 416 |
| 125 | Solana Beach, CA | 46 | 1 | 5 | 175 |
| 126 | Long Beach, CA | 23 | 2 | 5 | 414 |
| 127 | Centennial, CO | 23 | 2 | 5 | 204 |
| 128 | Birmingham, AL | 25 | 1 | 7 | 95 |
| 129 | Reston, VA | 7 | 2 | 18 | -12 |
| 130 | Fort Collins, CO | 42 | 1 | 5 | 165 |
| 131 | Santa Fe, NM | 14 | 2 | 7 | -17 |
| 132 | Calabasas, CA | 27 | 1 | 6 | 44 |
| 133 | Coral Gables, FL | 36 | 1 | 5 | 137 |
| 134 | Alpharetta, GA | 9 | 2 | 10 | 266 |
| 134 | Santa Clarita, CA | 65 | 1 | 4 | 256 |
| 136 | Stanford, CA | 11 | 2 | 7 | 20 |
| 137 | Omaha, NE | 4 | 4 | 23 | -41 |
| 138 | Provo, UT | 300 | 0 | 14 | -86 |
| 139 | Greenwood Village, CO | 12 | 4 | 5 | 489 |
| 140 | Eagleview, PA | 55 | 1 | 4 | 109 |
| 140 | Hayward, CA | 234 | 0 | 16 | -65 |
| 142 | Northbrook, IL | 24 | 2 | 4 | 253 |
| 143 | Lexington, MA | 220 | 0 | 14 | -81 |
| 144 | Burlington, VT | 12 | 1 | 10 | 6 |
| 145 | Gainesville, FL | 42 | 1 | 4 | 232 |
| 145 | Morrisville, NC | 19 | 1 | 6 | 62 |
| 147 | Charlottesville, VA | 11 | 1 | 11 | 22 |
| 147 | Westport, CT | 19 | 1 | 6 | 240 |
| 149 | Missoula, MT | 23 | 1 | 5 | 154 |
| 150 | West Palm Beach, FL | 23 | 1 | 5 | 106 |
| 151 | San Antonio, TX | 8 | 1 | 13 | -63 |
| 152 | Hoboken, NJ | 12 | 2 | 5 | 337 |
| 153 | Draper, UT | 15 | 3 | 4 | 591 |
| 154 | Foster City, CA | 293 | 0 | 8 | -86 |
| 155 | Winter Park, FL | 63 | 1 | 3 | 473 |
| 156 | Bedford, MA | 15 | 1 | 6 | -54 |
| 157 | Redmond, WA | 272 | 0 | 8 | -26 |
| 158 | Fayetteville, AR | 6 | 2 | 7 | 135 |
| 158 | Union City, CA | 17 | 2 | 4 | 382 |
| 160 | Basking Ridge, NJ | 57 | 1 | 3 | 245 |
| 160 | Creve Coeur, MO | 182 | 0 | 9 | -35 |
| 162 | San Bruno, CA | 250 | 0 | 8 | -1 |
| 163 | Daly City, CA | 5 | 2 | 8 | 4 |
| 163 | Tucson, AZ | 7 | 1 | 11 | 53 |
| 165 | Industry, CA | 52 | 1 | 3 | 463 |
| 166 | San Ramon, CA | 77 | 0 | 13 | 49 |
| 167 | Fulton, MD | 10 | 1 | 8 | -33 |
| 168 | Huntington Beach, CA | 45 | 1 | 3 | 321 |
| 169 | Farmington, CT | 4 | 2 | 9 | 249 |
| 170 | Memphis, TN | 2 | 2 | 25 | 68 |
| 171 | Cottonwood Heights, UT | 11 | 1 | 6 | -72 |
| 171 | San Juan Capistrano, CA | 5 | 1 | 14 | 197 |
| 173 | Watertown Town, MA | 137 | 0 | 8 | -91 |
| 174 | Glendale, CA | 7 | 1 | 9 | 226 |
| 175 | Portland, ME | 9 | 1 | 7 | -34 |
| 176 | Santa Cruz, CA | 625 | 0 | 5 | 263 |
| 177 | Arlington, MA | 7 | 2 | 5 | 58 |
| 178 | Paradise, NV | 6 | 3 | 5 | 450 |
| 179 | Lehi, UT | 6 | 1 | 9 | -102 |
| 179 | Mesa, AZ | 20 | 1 | 4 | 128 |
| 179 | Portsmouth, NH | 20 | 1 | 4 | 361 |
| 182 | Chandler, AZ | 5 | 2 | 6 | 307 |
| 183 | Newark, DE | 6 | 1 | 9 | -31 |
| 183 | Trumbull, CT | 18 | 1 | 4 | 357 |
| 185 | San Luis Obispo, CA | 10 | 2 | 4 | 443 |
| 186 | Hoover, AL | 30 | 1 | 3 | 222 |
| 187 | Fort Worth, TX | 17 | 1 | 4 | 95 |
| 188 | Kansas City, MO | 2 | 2 | 11 | 17 |
| 189 | Vista, CA | 26 | 1 | 3 | 77 |
| 190 | White Plains, NY | 11 | 3 | 3 | 1034 |
| 191 | San Leandro, CA | 186 | 0 | 5 | 147 |
| 192 | Reno, NV | 5 | 1 | 8 | 208 |
| 193 | Corte Madera, CA | 24 | 1 | 3 | 435 |
| 194 | Saratoga, CA | 79 | 0 | 6 | -100 |
| 195 | North Bethesda, MD | 59 | 1 | 2 | 549 |
| 195 | Orem, UT | 4 | 2 | 5 | 266 |
| 197 | Silver Spring, MD | 4 | 2 | 5 | -58 |
| 198 | Poway, CA | 55 | 1 | 2 | 546 |
| 199 | Bethlehem, PA | 2 | 2 | 9 | 51 |
| 200 | Manhattan Beach, CA | 5 | 1 | 6 | 93 |
Trends for Startup Cities
Breaking Records
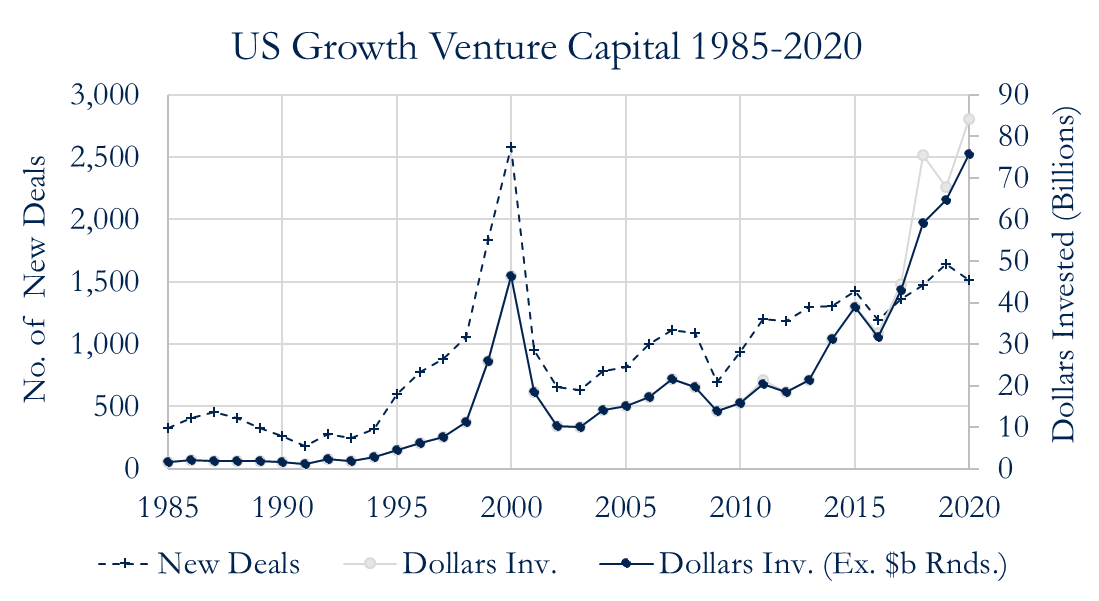
Twenty-twenty was a record year in terms of dollars invested, though a small number of very high-value deals enlarged the aggregate amount. A trend of billion-dollar rounds that began with Lyft in 2017 has continued into 2020. (Yes, Facebook had a billion-dollar round in 2011, but there weren’t any others for six years.) Some billion-dollar rounds are, at least notionally, seed or early-stage investments, like those into JUUL Labs, Quibi, and Rivian Automotive. Most are later stage rounds supporting firms like Uber, WeWork, and Epic Games as they try to find their exits.
There were four billion-dollar rounds in 2020. These included investments in Rivian, Waymo, SpaceX, and Epic, who had already taken a billion-dollar round in 2018. Epic Games is the main force behind Cary’s, and North Carolina’s, drive up the rankings.
COVID-19 Bump
Even without the billion-dollar rounds, U.S. venture investment levels are now above the dot-com boom’s heights in both nominal and real terms: Both 2018 and 2019 beat 2000 in nominal investment amounts. Twenty-twenty was the first to boast a higher amount than 2000’s U.S. venture capital investment adjusting for inflation.
There were reasons to think that the COVID-19 pandemic might cause a retrenchment in investment. In particular, the U.S. stock markets collapsed from February 12th to November 16th, 2020. Concern over returns to capital might have led L.P.s to reconsider new investments in alternative assets. There was also speculation that some L.P.s might renege on existing commitments to venture funds. Instead, the market for venture capital seems to have had a COVID-19 bump.
Concentration Among Startup Cities
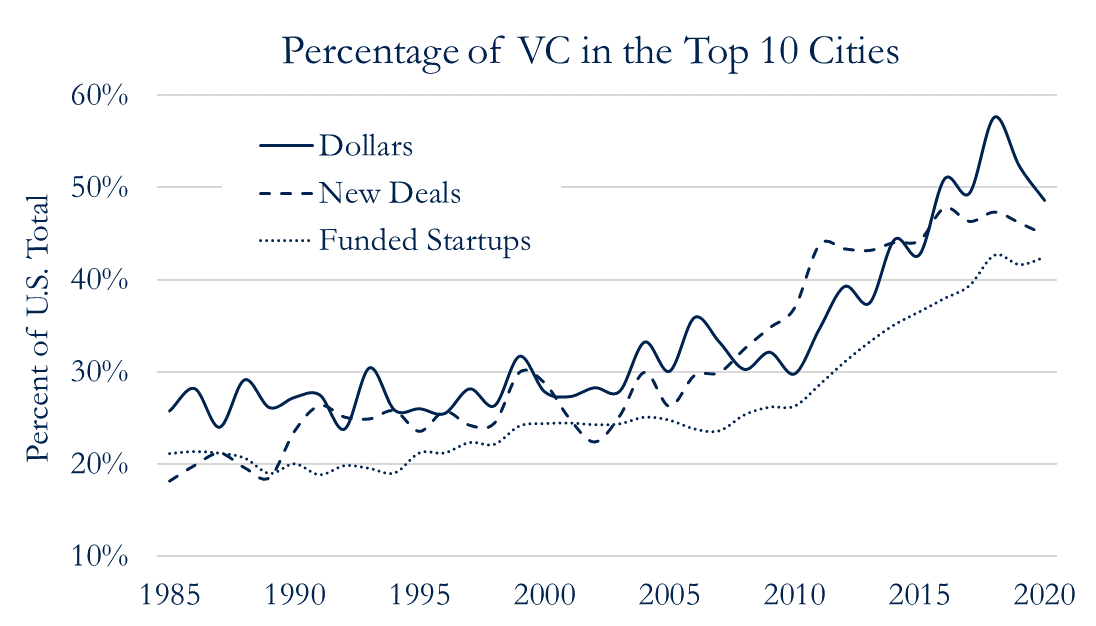
America has had a long-term trend towards greater concentration of venture capital dollars, deals, and startups within the top 10 startup cities. Over the last decade, the share of venture capital dollars invested in the top ten startup cities rocketed up. It went from about 30% in 2010 to almost 60% in 2018. Other measures of venture activity followed a similar trend. But this seems to have changed in 2020.
Greater concentration could be problematic if some cities are at or past their efficient capacity. For example, Palo Alto has the highest startup density in the U.S. and seems over-crowded with startups. (New York, though, looks like it still has plenty of room for more.) Then greater equality in venture capital across startup cities would enhance growth. So, it’s somewhat enheartening to see the top 10 startup cities’ share back below 50%. Presumably, lockdowns, travel restrictions, and everyone getting used to teleconferencing reduced the benefits to locating in the Bay Area or Route 128 ecosystems.
Is Houston a Startup City?
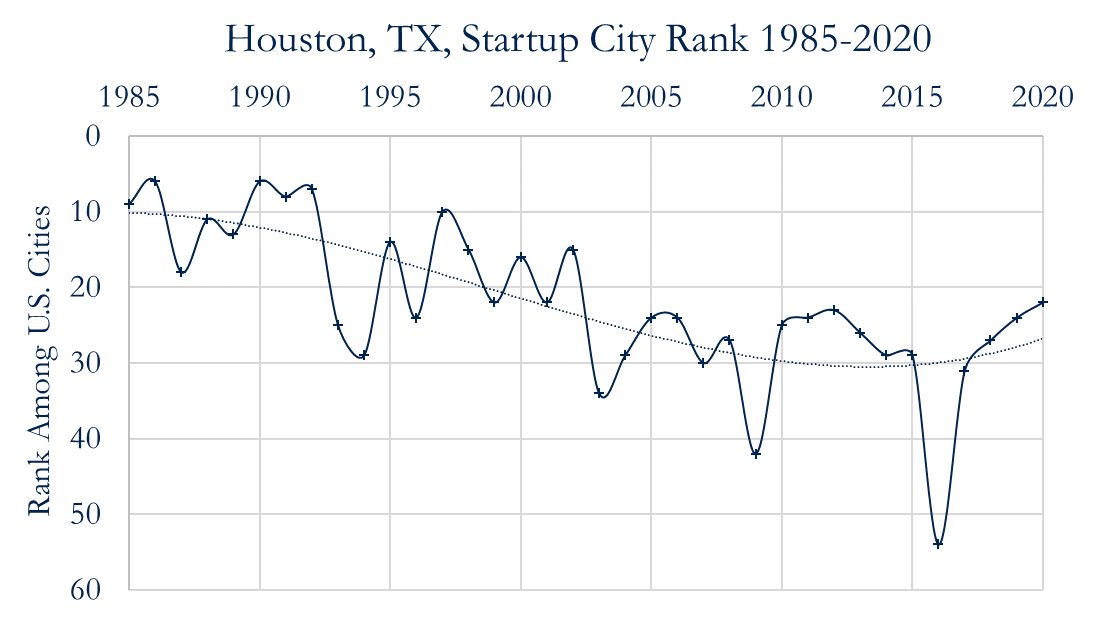
Houston, Texas, ranked 22nd among U.S. startup cities in 2020. That’s the Space City’s highest ranking since 2002. In 2016, it was ranked 54th, so Houston’s startup ecosystem has had an astronomical recent rise. Moreover, the city’s 2020 ranking components are now fairly evenly balanced: Houston ranked 19th for new deal flow, 24th for dollars invested, and 25th for active startups. (That new deal flow is driving Houston’s ranking suggests good things to come; follow-on rounds should assure more money and active startups in subsequent years.)
Why am I still reluctant to describe Houston as a startup city? Because Houston is the 4th largest metro area by population, the 7th largest by GDP, and boasts that it is home to 4,600 energy-related firms. It contributes just under half a trillion dollars to the U.S. economy each year.
In 2020, H-town added 13 new startups to its venture ecosystem, bringing its total headcount of actively-financed firms to 71. These firms collectively received a little over $650m. So, until someone works out how high-growth-high-tech and oil-and-gas go together, Houston will remain just the Energy Capital of the World. (Also, the space sector moved to California several decades back.)
A Historic Fall
I have written extensively about Houston’s fall in the rankings and the policy initiatives that exacerbated it, as well as the attempts to reform Houston’s startup economy that followed.
The short story is that Houston realized it had a problem with creating and retaining new high-growth, high-tech firms in the late 1990s. The city’s “solution,” announced in 1998 and launched in 1999, was the Houston Technology Center. The HTC then lead Houston to the largest and fastest ranking decline of any former top 20 startup city.
Fortunately, starting around 2011 and picking up pace in 2014, some new initiatives took hold in Houston. These were a mix of private firms and non-profits that were (mostly) unaffiliated with the HTC. Then, in 2016 a group of VCs and serial entrepreneurs with ties to the city started Station Houston, the city’s first startup hub.
Policy Takes Time
It takes a couple of years for a new initiative to take effect: On average, a startup is just under a year and a half old when it receives its first seed round, and over two and a half if its first round is a Series A. So the effects of policy in 2018 are just now starting to be felt. Twenty-eighteen was a big year for bad startup policy in Houston:
Market Forces
Of course, many other things were going on in Houston’s startup ecosystem in or around 2018, and some of them were positive. So, on balance, it looks like Houston’s prognosis is fair-to-good, despite its abysmal policy history.
First, deal flow surged to record highs in 2018. Houston was getting around six new deals each year from 2010 to 2016. In 2017, Houston got nine first-time venture investments, and in 2018 it got 17, before falling back to 13 new deals each year in 2019 and 2020. The two drivers of this boom were Station’s efforts before its takeover and Houston’s biotech scene, which finally found some legs: Liongard and Arundo Analytics were both Station residents that secured a first-round of VC in 2018 (and went on to raise almost $50m combined), and life science startups Vivante Health, Wellnicity, and Trilliant Surgical all got their first rounds that year. (Data Gumbo, a client of The Cannon, also got its first round in 2018.)
Second, many for-profits, non-profits, academics, and policymakers across the state were working hard to build high-growth, high-tech expertise and capabilities in Houston in 2018. This effort has translated into a wealth of new initiatives, programs, and ecosystem support organizations in 2020. Credit is particularly due to Lori Vetters, who led efforts to reach out to non-Houston accelerators despite being shunned by many Houston startup scene members for her lack of high-growth, high-tech pedigree. (Lori replaced Walter Ulrich and tried to reform the HTC.) Both the Texas Foundation for Innovative Communities in Austin and my team at the McNair Center for Entrepreneurship and Innovation also deserve honorable mentions.
Building Better Biotech
The Texas Medical Center Innovation Institute (TMC-II) got off to a rough start with its various initiatives, which included the TMCx, JLabs@TMC, and the AT&T Foundry. For instance, publicly-traded firms generally don’t attend startup accelerator programs, but Bellicum Pharmaceuticals was an early client of JLabs@TMC. Bellicum was the HTC’s sole IPO and listed on the NASDAQ. (It’s worth noting that JLabs@TMC has removed Bellicum from their publicly-available client lists. And that the TMC-II still appears to report Bellicum’s IPO proceeds in their “raised to date” stat.)
Nevertheless, the TMC-II’s program quality increased materially in late 2016 and reached a decent standard a few years later. Furthermore, John Reale, the former CEO of Station Houston, founded Integr8d Capital and shifted his focus to life science startups in 2018. He later became the entrepreneur-in-residence at the TMC-II as well. J.R. was crucial to Houston’s first market-driven reformation effort and is likely an essential factor in its second one too.
The Green Mountain State
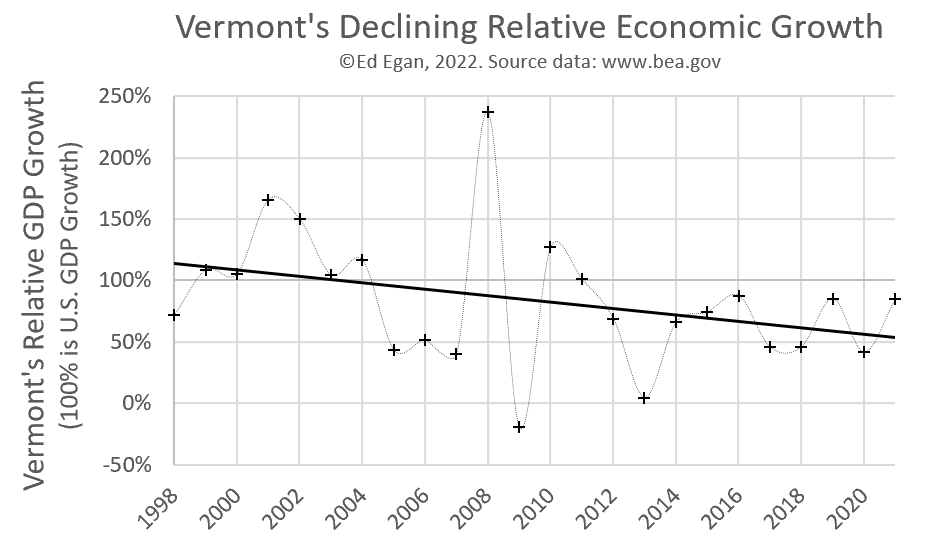
I also keep tabs on things going on in Vermont’s startup scene. Vermont is home to a tiny but growing startup ecosystem. In the 1990’s Vermont got around one new deal a year, and by the 2010s, Vermont averaged two and a half new deals a year. The U.S. doubled its deal flow over the same period, so, proportionately, Vermont is outpacing U.S. national growth. But in absolute terms, Vermont doesn’t have much. Since its first deal almost forty years ago, Vermont has received 125 rounds of VC., totaling just over $400m, into 56 companies. A top 30 city can comfortably achieve those numbers in a few months.
Agglomeration Powers Startup Cities
Historically, Vermont’s startups were mostly spread out down the I-89 east from Burlington. Vermont’s startup success stories include Dealer.com and Seventh Generation in Burlington, SunCommon in Waterbury, Keurig Green Mountain, which was up the road in Stowe, and Northern Power Systems in Barre. The jewel in the Green Mountain crown, though, is Casella Waste Systems in Rutland. (Casella has a surprising number of patents.)
Most of Vermont’s venture capital has gone into companies in Burlington though, which has increasingly dominated the state’s tech scene. This trend towards fewer startups outside of the Queen City is both good and bad. In the long-term, denser agglomeration is a powerful force for startups. But in the short-term, having fewer non-Burlington startups means having fewer startups. Until Burlington ups its game, or non-Burlington startups return, the state looks set to stay in the ebb part of its gentle ebb-and-flow in the bottom end of the U.S. startup state rankings.
Burlington is the only place in Vermont to make the top 200 startup cities list in recent history, and it has done so every year from 2014 to 2020, except 2016. Rutland, Vermont, made the top 200 list in 1994. Twenty-twenty is Burlington’s second-best year ever. (It has lagged well behind Burlington, Massachusetts since the 1980s, but has bested Burlington, North Carolina, handily every year since 1998.) But, with a rank of 144th and just one new deal and two follow-on rounds, it’s hard to describe the People’s Republic of Burlington as a real startup city.
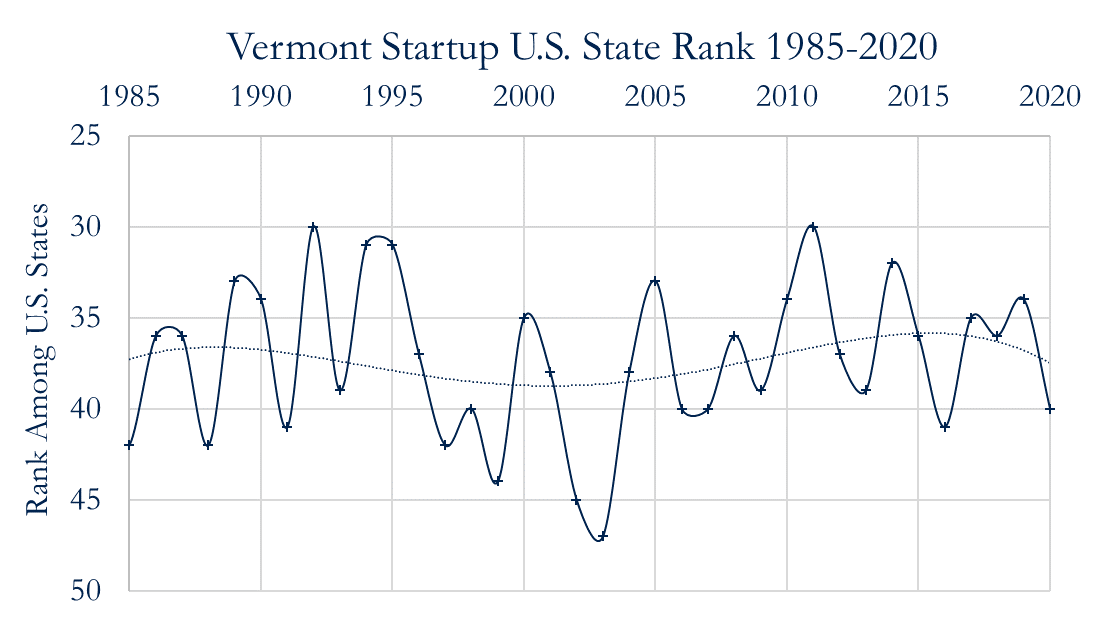
Among the 50 states, the District of Columbia, and Puerto Rico, Vermont has consistently ranked in the mid to late-thirties. In 2020, there were no new deals and no follow-on rounds outside Burlington, and Vermont takes 40th place in the U.S. startup state ranking.
Startup Cities Ranking Methodology
The startup cities ranking uses an open methodology that anyone can use and recreate, and data on the top 200 startup cities from 1985 to 2020 is freely available.
This article’s results are based on data from Thomson Reuter’s VentureXpert, who survey venture capitalists. The rankings consider only data on “growth venture capital. ” Growth venture capital is seed, early, or later-stage investment into privately-held, (predominantly) high-tech high-growth startups. (The main alternative is transactional venture capital, which includes investments into publicly-traded firms and large non-tech incumbents).
The reported rankings are a rank-of-ranks over three measures that capture related but different aspects of a city’s startup ecosystem:
- The amount of venture capital dollars invested.
- The number of new deals (i.e., startups receiving VC for the first time).
- The number of actively-funded startups (i.e., startups receiving stages of VC and working towards an exit).
