

Readers of American financial news might think that the pandemic stock market crash of 2020 happened in March and is over. That’s objectively not true: the pandemic stock market crash is still going on right now, and an analysis of past crashes suggests it’s about to get a lot worse.
A crash is not just a substantial daily or monthly decline. Instead, stock markets have two modes: crash and boom. The market is in a crash from its prior peak until its recovery. And seven out of 12 of America’s last stock market crashes have had at least one faux recovery.
Indices track the market. I use the Dow, but you can use the S&P 500, the Russell 3000, or whatever you like. The Dow’s most recent prior peak, before it suffered substantial declines, was of 29,551 points on February 12th, 2020. It hasn’t sustained that value again yet. Ergo, the U.S. stock markets are in a crash!
U.S. stock markets are in a crash!
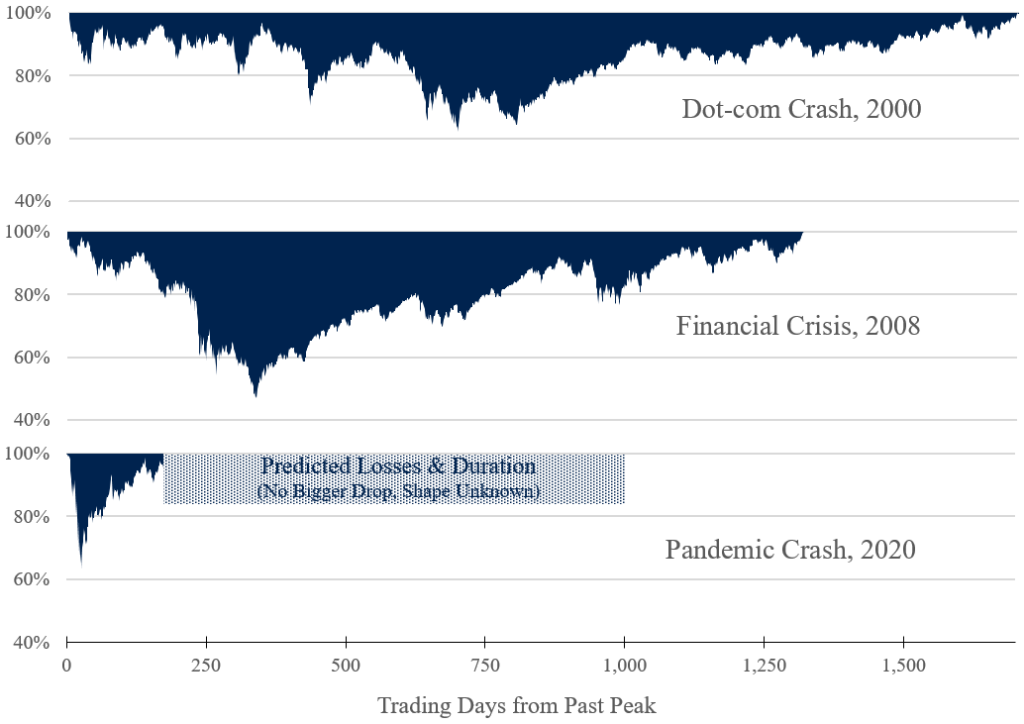
Around five-sixths of the pandemic crash is still to come.
(Nit-pickers among you may ask how to define substantial decline and sustained recovery. The data suggests the answers are 5% daily declines and one month of trading (i.e., 21 consecutive trading days), respectively. Likewise, followers of the S&P500 may ask whether this works for them. The answer is yes: Using the S&P500, U.S. markets are in a crash. The S&P500 achieved a peak of just over 3,386 on February 19th, 2020. To date, the longest consecutive series of trading days surpassing this value was 11 days long, ending on September 4th. We have had eight consecutive trading days above the past peak since October 8th. Accordingly, using the S&P500, the soonest the crash could end would be November 5th, 2020.)
Learning From Past Crashes
More importantly, there are good reasons to believe that, in terms of its duration and its value destruction, around five-sixths of the pandemic crash is still to come.
Stock prices are inherently unpredictable. As any financial product vendor is required to tell you, past returns are not indicative of future performance. However, stock markets do show what economists call “empirical regularities.” Think of them as reoccurring patterns. For example, the market typically drops a little in September.
Where many analysts go wrong is in looking for regularities in the shapes of crashes. They ask things like: Does the crash look like a V, a W, a U, or an L? How many bad days does the crash have? And does the bottom happen early or later on? The shape of crashes is (mostly) random, but that doesn’t mean everything about a crash defies analysis.
Some empirical regularities are readily apparent in data on U.S. stock market crashes: Crashes with bigger total drops go on longer and destroy more value. And crash sizes go hand-in-hand with some measures of the economy like interest rate spreads.
Empirical Regularities
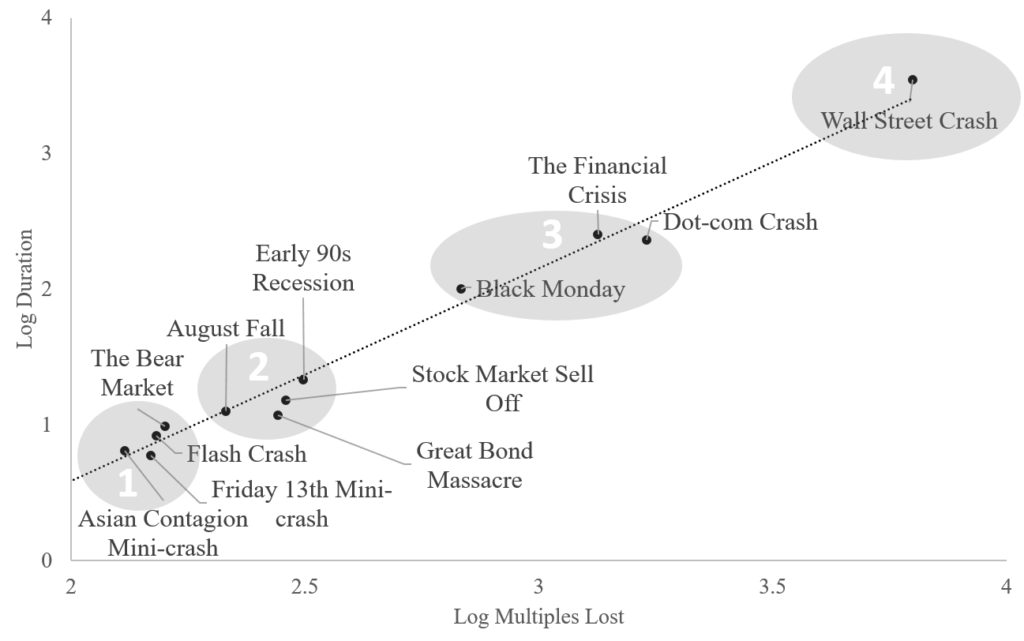
There have been just 12 crashes in America in the modern era of electronic stock markets, not including the current one, which is a small sample. Nevertheless, the correlations between three simple measures of a crash’s size – its duration, maximum drop, and value lost – are extremely strong., and it is exceedingly unlikely to find these correlations by chance. For example, the correlation between the duration and losses of crashes in the data is 98%, and the odds that these measures are actually uncorrelated are less than one in one hundred million. Put another way: if you plot any two of these measures, you’ll find that all the points sit right near a linear line of best fit.
How to Measure a Stock Market Crash in Four Easy Steps
- Pick an index.
- Find the prior peak.
- Find when sustained recovery occurs.
- Measure the duration, maximum reduction, and the value lost (in multiples of the past peak).
Using the Financial Crisis of 2007 to 2013 as an example:
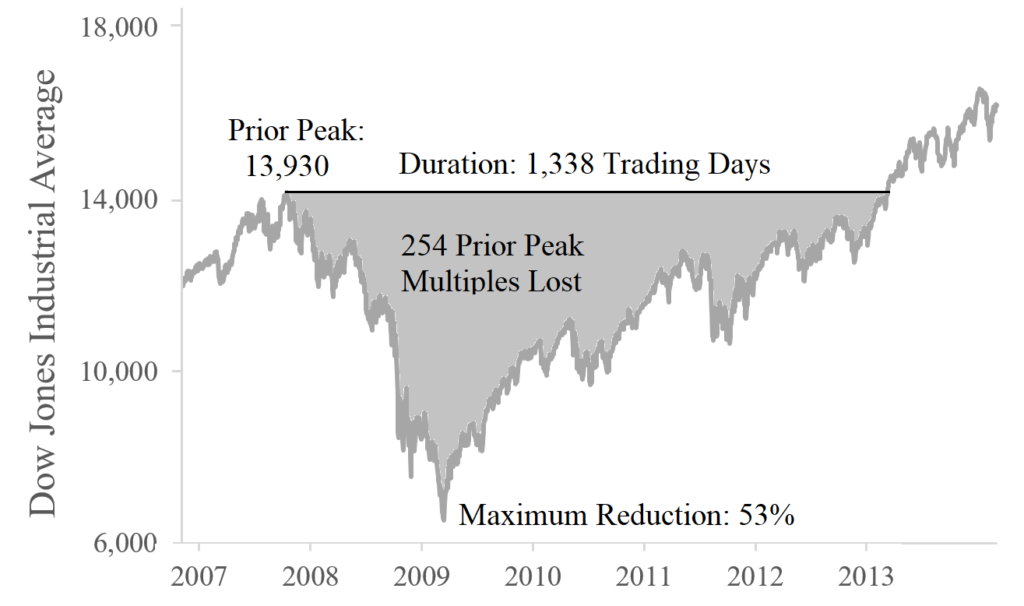
- I use the Dow an index.
- The prior peak was at 13,930 points on October 31st, 2007.
- The recovery began on February 26th, 2013.
- The crash lasted 1,338 trading days (about 5 years), has a maximum drop of 53%, and lost 254 multiples.
Categorizing a Stock Market Crash
Each of the three measures of crash size shows obvious clustering, so every U.S. stock market crash fits nicely into one of four well-defined categories based on size. Crashes range from a Category 1, which includes events like flash crashes, to the Wall Street Crash of 1929, America’s only Category 4.
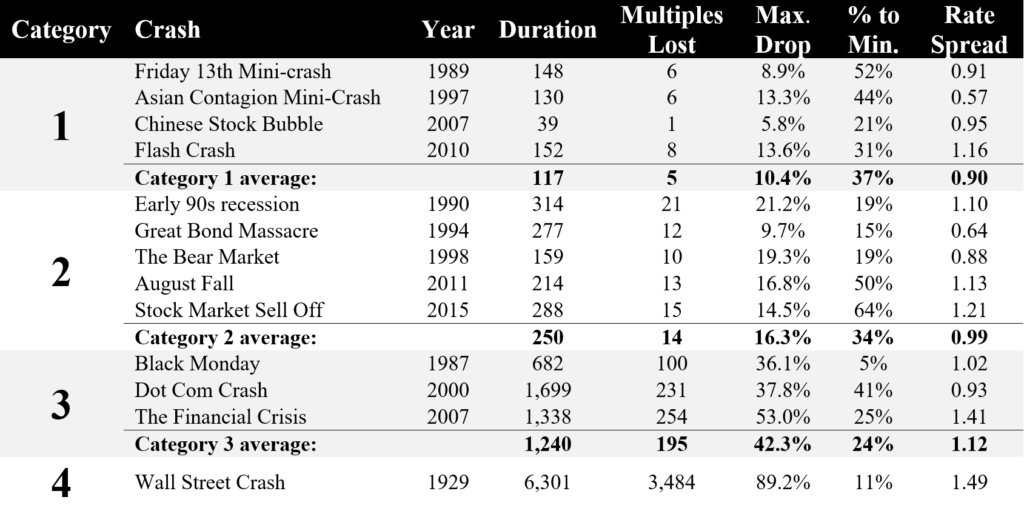
Using the Dow as an index, a typical Category 3 crash lasts for about five years, loses about 200 multiples of its past peak, and has maximum declines of around 40%. Compared with a Category 2, it is five times as long, almost 15 times as value-destroying, and about two-and-a-half times as deep.
Recording crash size in past peak multiples gives an easy to remember scale. Category 1 crashes lose less than ten multiples, Category 2s lose tens of multiples, and Category 3s lose hundreds, and so on.
How Big will the 2020 Crash Be?
Timing Matters
There are at least three reasons to believe that America is currently in a Category 3 crash.
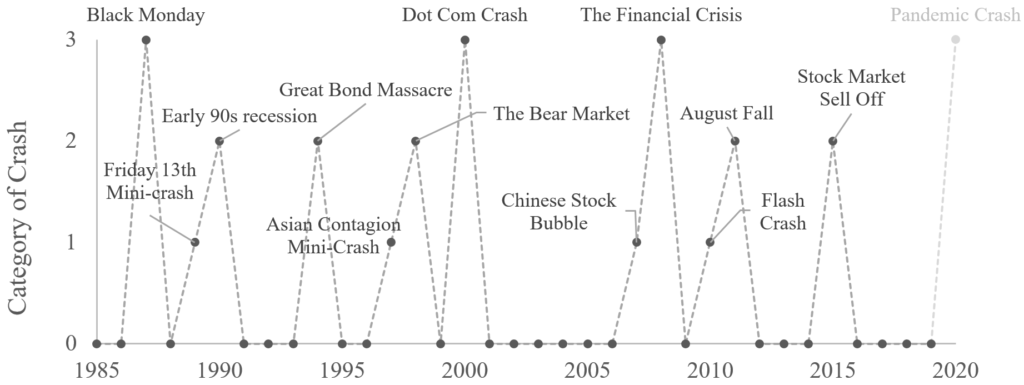
One reason is timing. Either a Category 2 or a Category 3 crash appears fairly reliably every four years. Likewise, a Category 3 crash arrives more or less every ten years. The Black Monday crash of 1987, the dotcom crash of 2000, and the financial crisis crash of 2007 were all Category 3s. The last two Category 2 crashes were the August Fall of 2011 and the 2015 Stock Market Sell-Off. So, a Category 3 in 2020 best fits the pattern.
Categorical Predictions
However, once a stock market crash has started, there are much better ways to tell how big it will be than its timing.
First, crash sizes go hand-in-hand with some measures of the economy, like the interest rate spread. Since March 2020, the spread between Baa and Aaa-rated corporate bonds has been consistent with a Category 3 crash. It spiked up from 0.83 in February to 1.7 in April, before recently dropping back to around 1.0. It has averaged just over 1.2 so far.
Second, because the shape of a crash is (mostly) random, the biggest decline could happen at almost any time. In the Black Monday crash, the Dow hit bottom practically right away, whereas the bottom of the 2015 Stock Market Sell-Off occurred two-thirds of the way through. There was a huge decline early on with the pandemic crash, providing an excellent signal of what’s to come. From a prior peak of 29,551 points on February 12th, 2020, the Dow hit 37% down on March 23rd, 2020. This drop is right in line with a Category 3 crash.
If this is a Category 3 crash… the Dow should lose about nine times its losses to date over the next four and a bit years.
If this is an average Category 3 crash, then it’s about 12% done. The Dow has lost just under 22 multiples of its past peak in the last seven months: 22 is about 12% of 200, and seven months is about 12% of five years. So the Dow should lose about nine times its losses to date over the next four and a bit years.
Simple Econometrics
Of course, you don’t need to use the categories to predict how big the crash will be or how long it will last. You can use the data on crashes and an econometric model instead. The simplest version of this method, which places almost no structure on the problem, uses univariate Ordinary Least Squares regression. (If you want to try this at home, you can do it in excel with the data from the table above.)
Using this approach requires one crucial assumption: that the biggest drop has already happened. If 37% down is as bad as it gets, then the pandemic crash is currently around 16% complete, and the Dow should average about 25,000 for the next four years. Moreover, you can use the confidence intervals from the regression to calculate a lower bound. The data says that you should be 95% sure that the crash will lose at least another 25 multiples of the past peak (i.e., the U.S. markets are going to repeat all the losses since March all over again, and then some, before they reach their recovery). Of course, if a bigger drop comes along, you’d have to revise all of these estimates upwards.
Brace For Impact?
It’s October 20th, 2020, and the U.S. stock markets had a bad day yesterday. The Dow opened this morning at 28,246 points, four and a half percent short of its February peak. So, I’ll have to wait at least another month to see if the pandemic crash of 2020 is lucky number 13 and bucks the pattern set by its 12 predecessors.
I do think that further stock market tumult is coming. I’ve been waiting for it for a while. I wrote the first version of this article in early August and submitted a paper about “Empirical Regularities in Stock Market Crashes” for peer-review in early September. However, the empirical regularities of stock market crashes are only a part of the story.
Every economist that I have spoken to since March has taken their investments and pensions out of U.S. equities. Their reasons vary and should be the topic of some further articles. For now, though, the obvious question is: Are you building a massive portfolio of put options?
Reference(s)
- Egan, Edward J. (2020), “Empirical Regularities in Stock Market Crashes“. Available at SSRN: https://ssrn.com/abstract=3679630.